Perovskite Solar Cell Testing Up To 12 Times Faster
How Chronotope trained full-device perovskite models that outperform state-of-the-art predictors by up to nearly 2x, predict both initial performance and 500-hour degradation before any physical fabrication, and cut down the testing needed to find the best cell by ~92%.
The Need for Novel Solar Cells
Solar energy has a strategic problem. More than 80% of the world’s manufacturing capacity across the main stages of solar-panel production is concentrated in China. As energy demand rises, solar production needs to be diversified for it to scale accordingly.
Perovskites are one of the clearest candidates. They can be processed as thin films, tuned for different parts of the solar spectrum, and stacked on top of silicon to make tandem cells. The commercial point is simple: make existing solar more powerful, and even when stacked on silicon, perovskites reduce dependence on China by moving the next major solar efficiency gain into new materials, coating processes, equipment, and IP that the U.S. and allied manufacturers can produce.
Standard commercial silicon panels are usually around the low-20% efficiency range. Perovskite-silicon tandem cells have reached the mid-30% range in research settings. That means up to roughly 1.5× more power from the same area, and it is reasonable to believe they could reach a 2x improvement.
The Perovskite R&D Problem
The problem is that, besides pushing power-conversion efficiency, we still need to understand long-term stability and degradation.
A Perovskite solar cell is a complex system. It is a full stack containing absorber, transport layers, contacts, architecture, additives, processing conditions, and interfaces. Local changes propagate chaotically, and behavior is governed by emerging properties.
It is thus very hard to predict how efficient a cell will be in the abstract, let alone over a long period of time having been exposed to real-world conditions.That implies teams having to build full cells and testing them for weeks or months in expensive, capacity-constrained equipment such as solar simulators, environmental chambers, and PL / EL characterization systems. Every guess is highly costly, and in retrospect it usually becomes evident that most recipes were never going to work.
The design space is too large and too coupled for traditional R&D to search efficiently. If the funnel is so expensive, the vast majority of candidates should be discarded ahead of it.
Chronotope tackled this problem in a recent case study with a Perovskite solar panel company.
Our series of models read the theoretical device recipe, predict both power-conversion efficiency and durability, and design the most efficient R&D path to find the highest-performing cell.
We outperformed any other published predictors and showed a 6-12x testing reduction.
Reading The Full Cell Before It Is Built
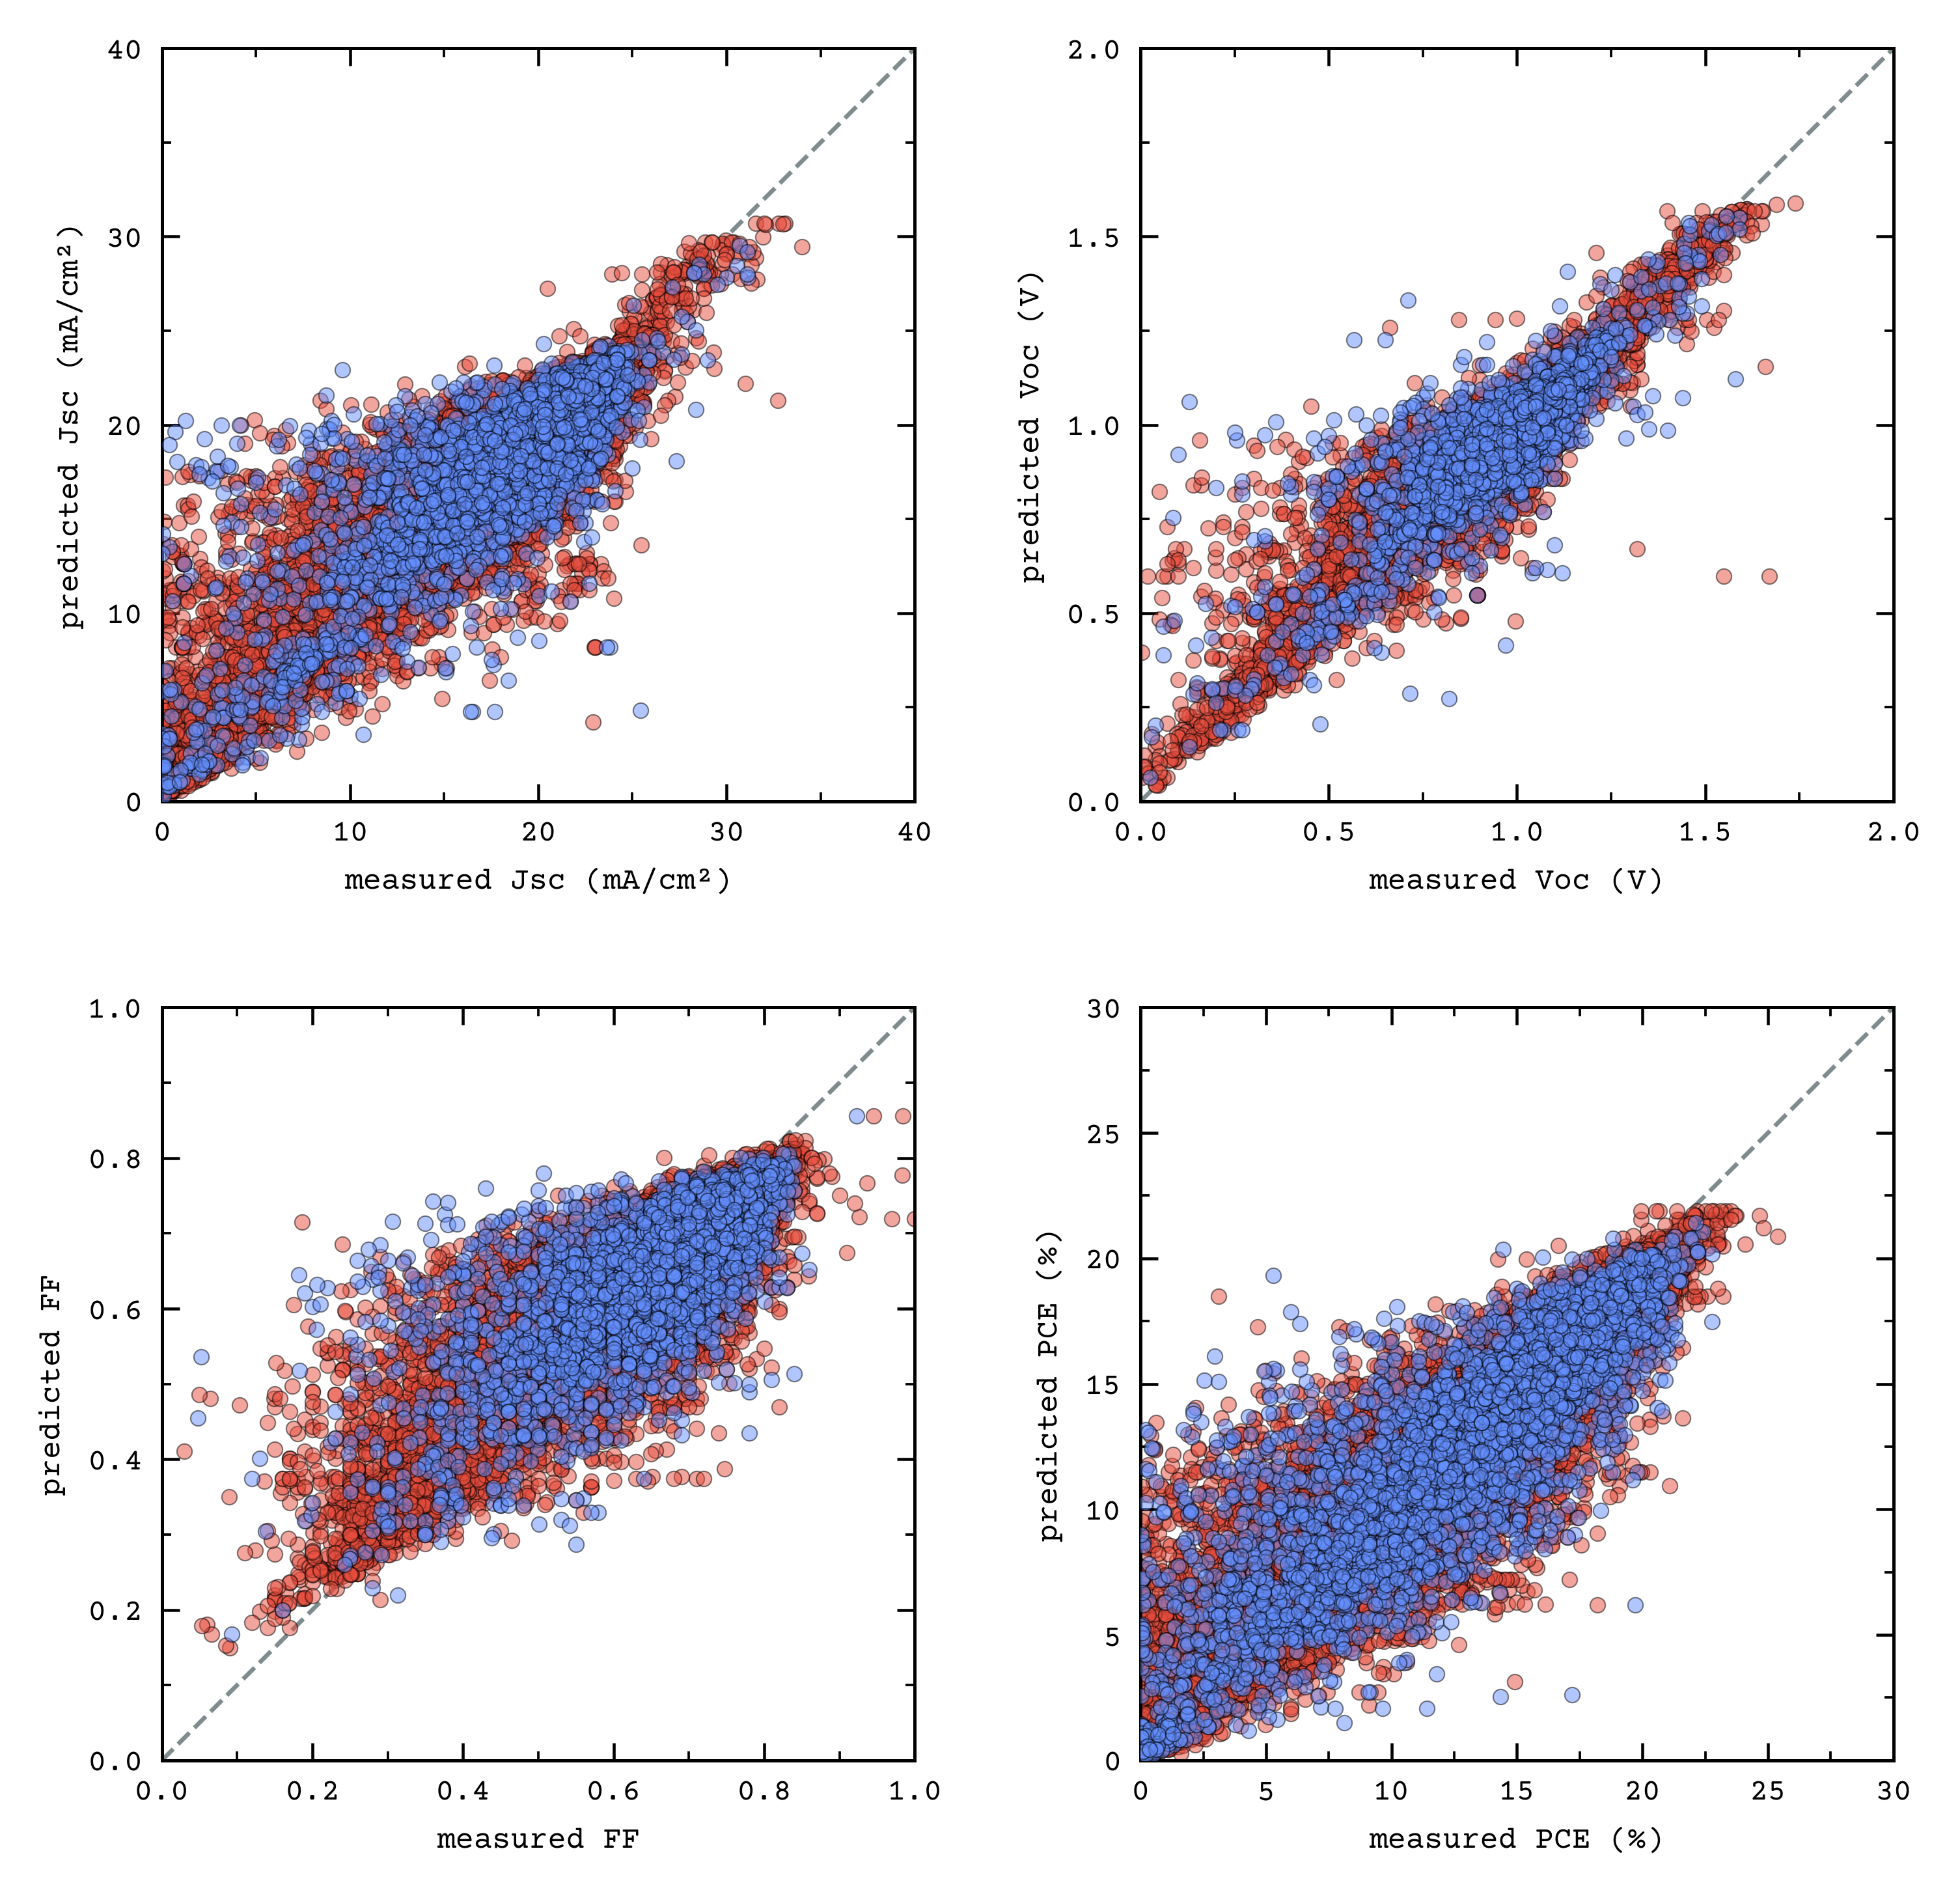
The model sees the absorber, transport layers, contacts, architecture, additives, and processing conditions as one coupled system. It encodes the physics-relevant structure of the device, so the model can translate a proposed cell recipe into expected device behavior. It predicts the four numbers that mainly define the cell: short-circuit current, open-circuit voltage, fill factor, and power-conversion efficiency (Jsc, Voc, FF, and PCE respectively).
State-Of-The-Art Performance Prediction
We tested the model on held-out perovskite devices. It reached R² values of 0.71 for PCE, 0.68 for Jsc, 0.71 for Voc, and 0.55 for FF. R² measures how much of the real experimental variation the model explains, with it equaling 1 meaning perfect prediction, so these results show strong predictive power on noisy, real-world device data.
With this work, Chronotope sets a completely new bar we top the best published perovskite predictors. Our PCE R² of 0.71 severely outperforms Solar-GECO at 0.42 and the semantic graph-network of Aneesh and colleagues at 0.44. Those papers come from NeurIPS 2025 and ICLR 2025 respectively, two of the top ML conferences. Our Jsc R² of 0.61 also shows an almost-2x increase from the 0.35 benchmark previously reported in Adv. Phys. Reasearch 2024.
Initial Performance Is Not Enough
Solar cells must maintain high efficiency for years under real-world operating conditions such as moisture, rain, sunlight, wind, and temperature fluctuations. So although initial performance is a good indicator, a perovskite cell that starts strong but potentially quickly degrades is not the target.
The main open problem in the field is understanding degradation and stabilizing the structure over time, so we built an additional model that predicts if the cell will be high-performing enough for it to be worth manufacturing and testing.
The models uses the cell description and our initial performance predictions to determine whether a device is likely to retain at least 80% of its efficiency after 500 hours of operational light-soaking.
Over 70% of the devices predicted to pass the 500-hour durability test actually pass, and we identify well over 65% of all devices that truly pass.
These results are on par with state-of-the-art durability models. The difference is that previous models use real initial performance measurements from the fabricated cell as inputs. Chronotope uses its own predicted performance values instead.
Unlike all other models, we achieve this level of accuracy without having to actually manufacture any part of the stack, before even PCE is measured, and before months of stability testing begin, just using the theoretical description.
Developing the Optimal Cell
No models can automatically tell exactly what is the best cell, but these can design a much more efficient R&D process to get to it.
Our models take the cell candidates with whose performance is high enough and predicted to last for long enough to survive the 500-hour durability screen and rank them by predicted performance and confidence. That way we always prioritize those cells on the tail of the distribution, the most likely to have the best, longest-lasting performance.
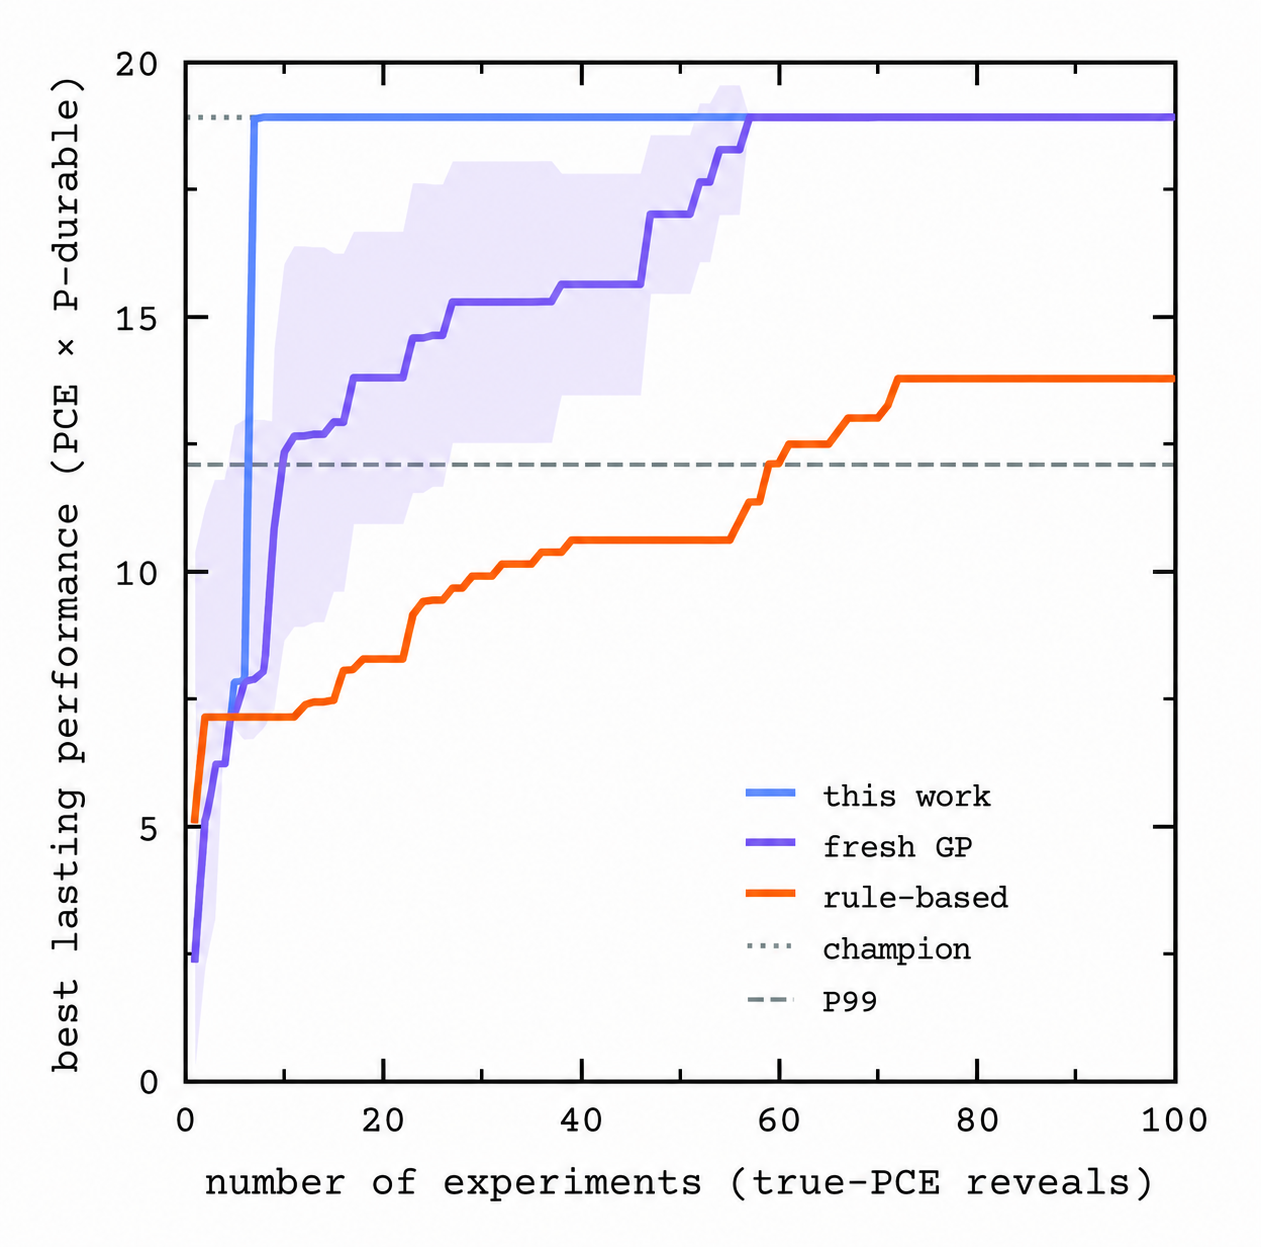
We deployed these trained models on a production dataset of 3,912 measured perovskite devices. The model saw only recipes, not outcomes, and selected candidates sequentially as if guiding R&D decisions. After each selected "experiment," the priors of each model were updated with the measured experimental values from the dataset. The objective was durability-adjusted performance.
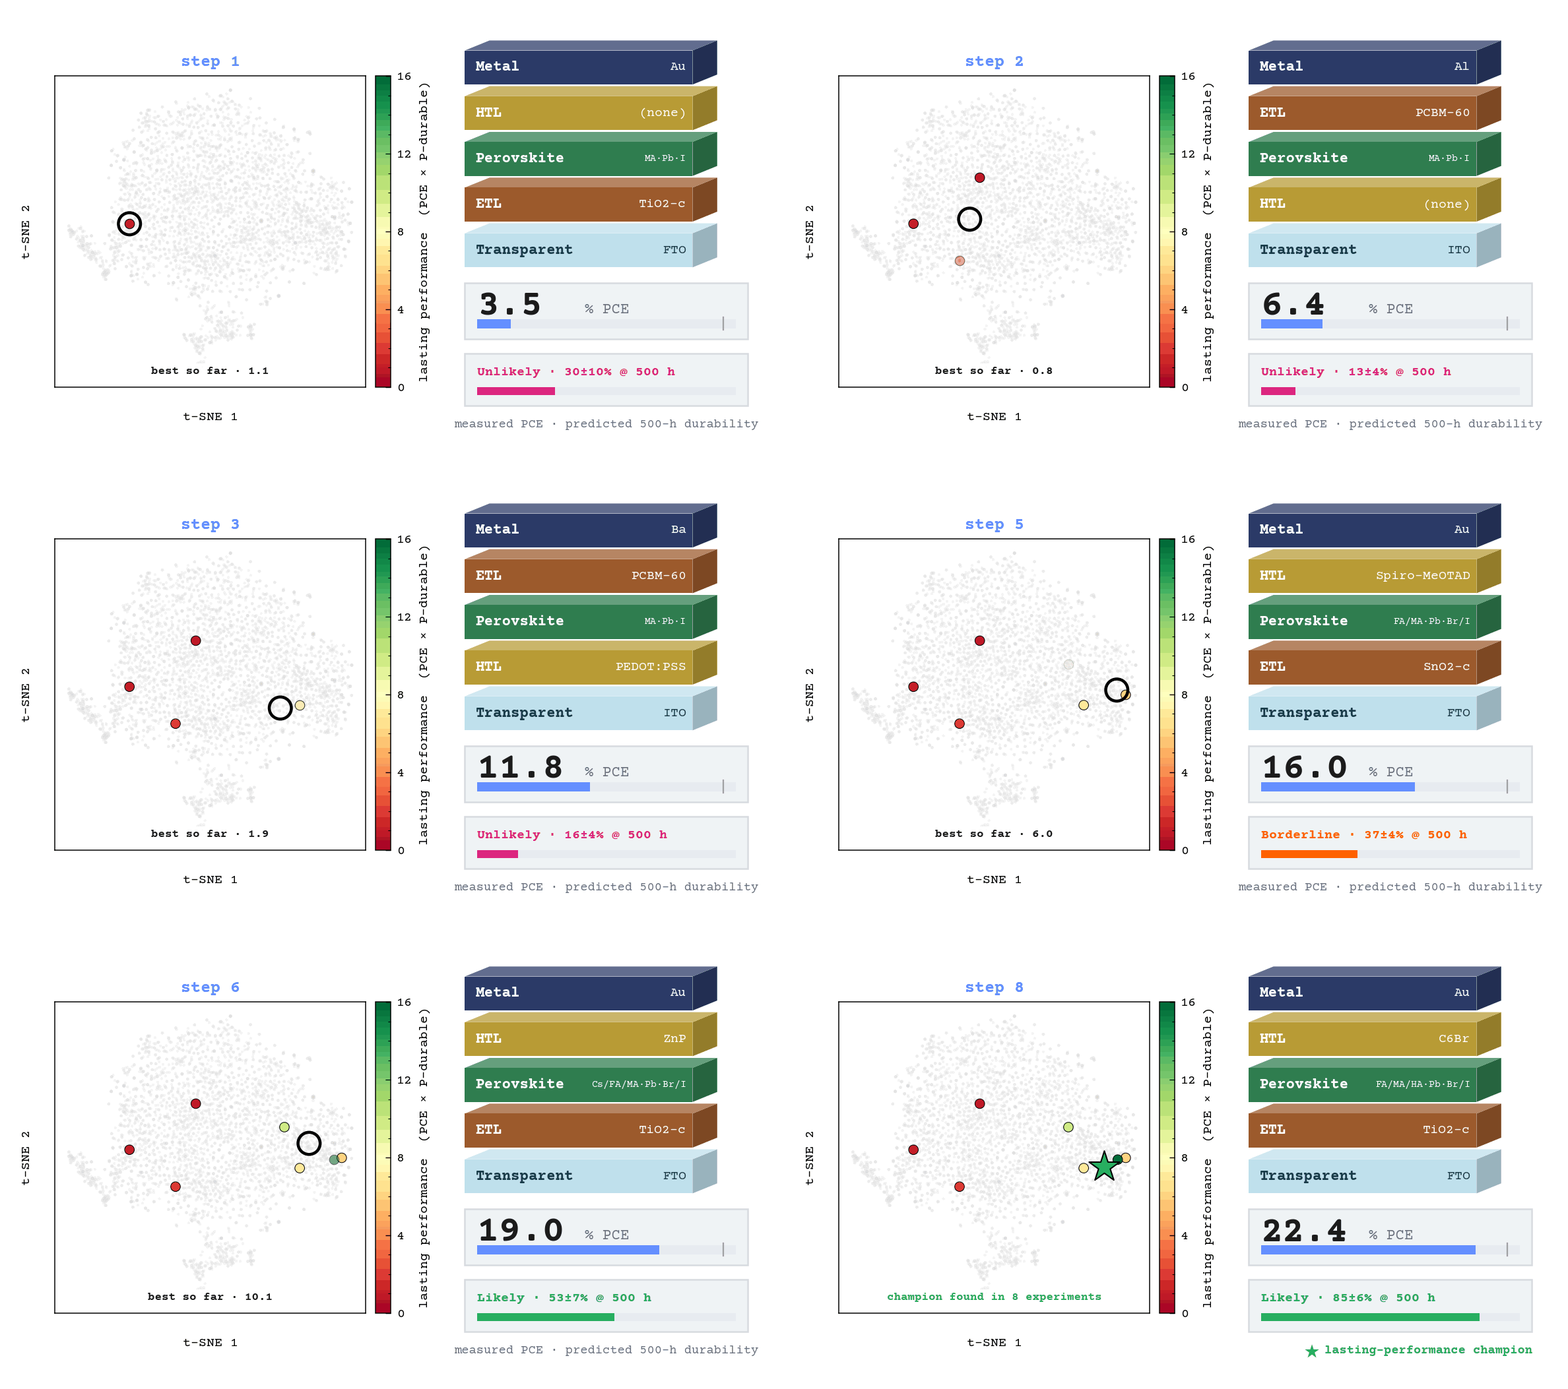
Chronotope identified the top-performing device in just 8 selections out of the almost 4,000 possibilities. It took a Gaussian process, simpler statistical search, 50+ experiments, and the rule-based process analogous to what the traditional R&D team used over 100. See the 8 structues and experiments tried in the animation at the top of the page.
This is 6 times faster than any other method, and 12 times faster than the previous method used on these devices. Chronotope models represent a cut of at least 84% to 92% of the testing time and spending.
Physical Interpretability
The obvious question at this point is why Chronotope can predict these cells so well. The answer is that, as mentioned, perovskite performance is an emergent property of the full device. It is not determined by one composition, one transport layer, or one processing step. It comes from the coupled behavior of the absorber, interfaces, additives, electrodes, architecture, processing conditions, and test environment.That is why traditional computational modeling has struggled with this material. As the system becomes too complex, the full fabricated device is too coupled, too process-dependent, and too sensitive to interfaces for composition-level modeling to be enough.
Our models learn the physics behind the structure-behavior relationship directly, and understand which combinations of layers, contacts, additives, and process choices repeatedly lead to higher PCE, stronger Voc, better fill factor, and better durability.
Some interesting takeaways are that stability protocol, the test temperature, and atmospheric environment push the physically expected way, with light-soak, heat, potential oxidation dragging a cell toward less durable. The design of the cell itself also leaves a clear mark. A Spiro-MeOTAD or PEDOT:PSS hole-transport layer pushes the same way. A higher methylammonium fraction trends toward less durable, consistent with MA's known volatility and ion migration, though well-encapsulated MA cells can still last. The back electrode splits cleanly: silver contributes to durability negatively, consistent with metal–halide reactions at the contact. In contrast, higher Voc, FF, Jsc, certain kinds of additives, encapsulation, and PCE can stabilize the cell further.
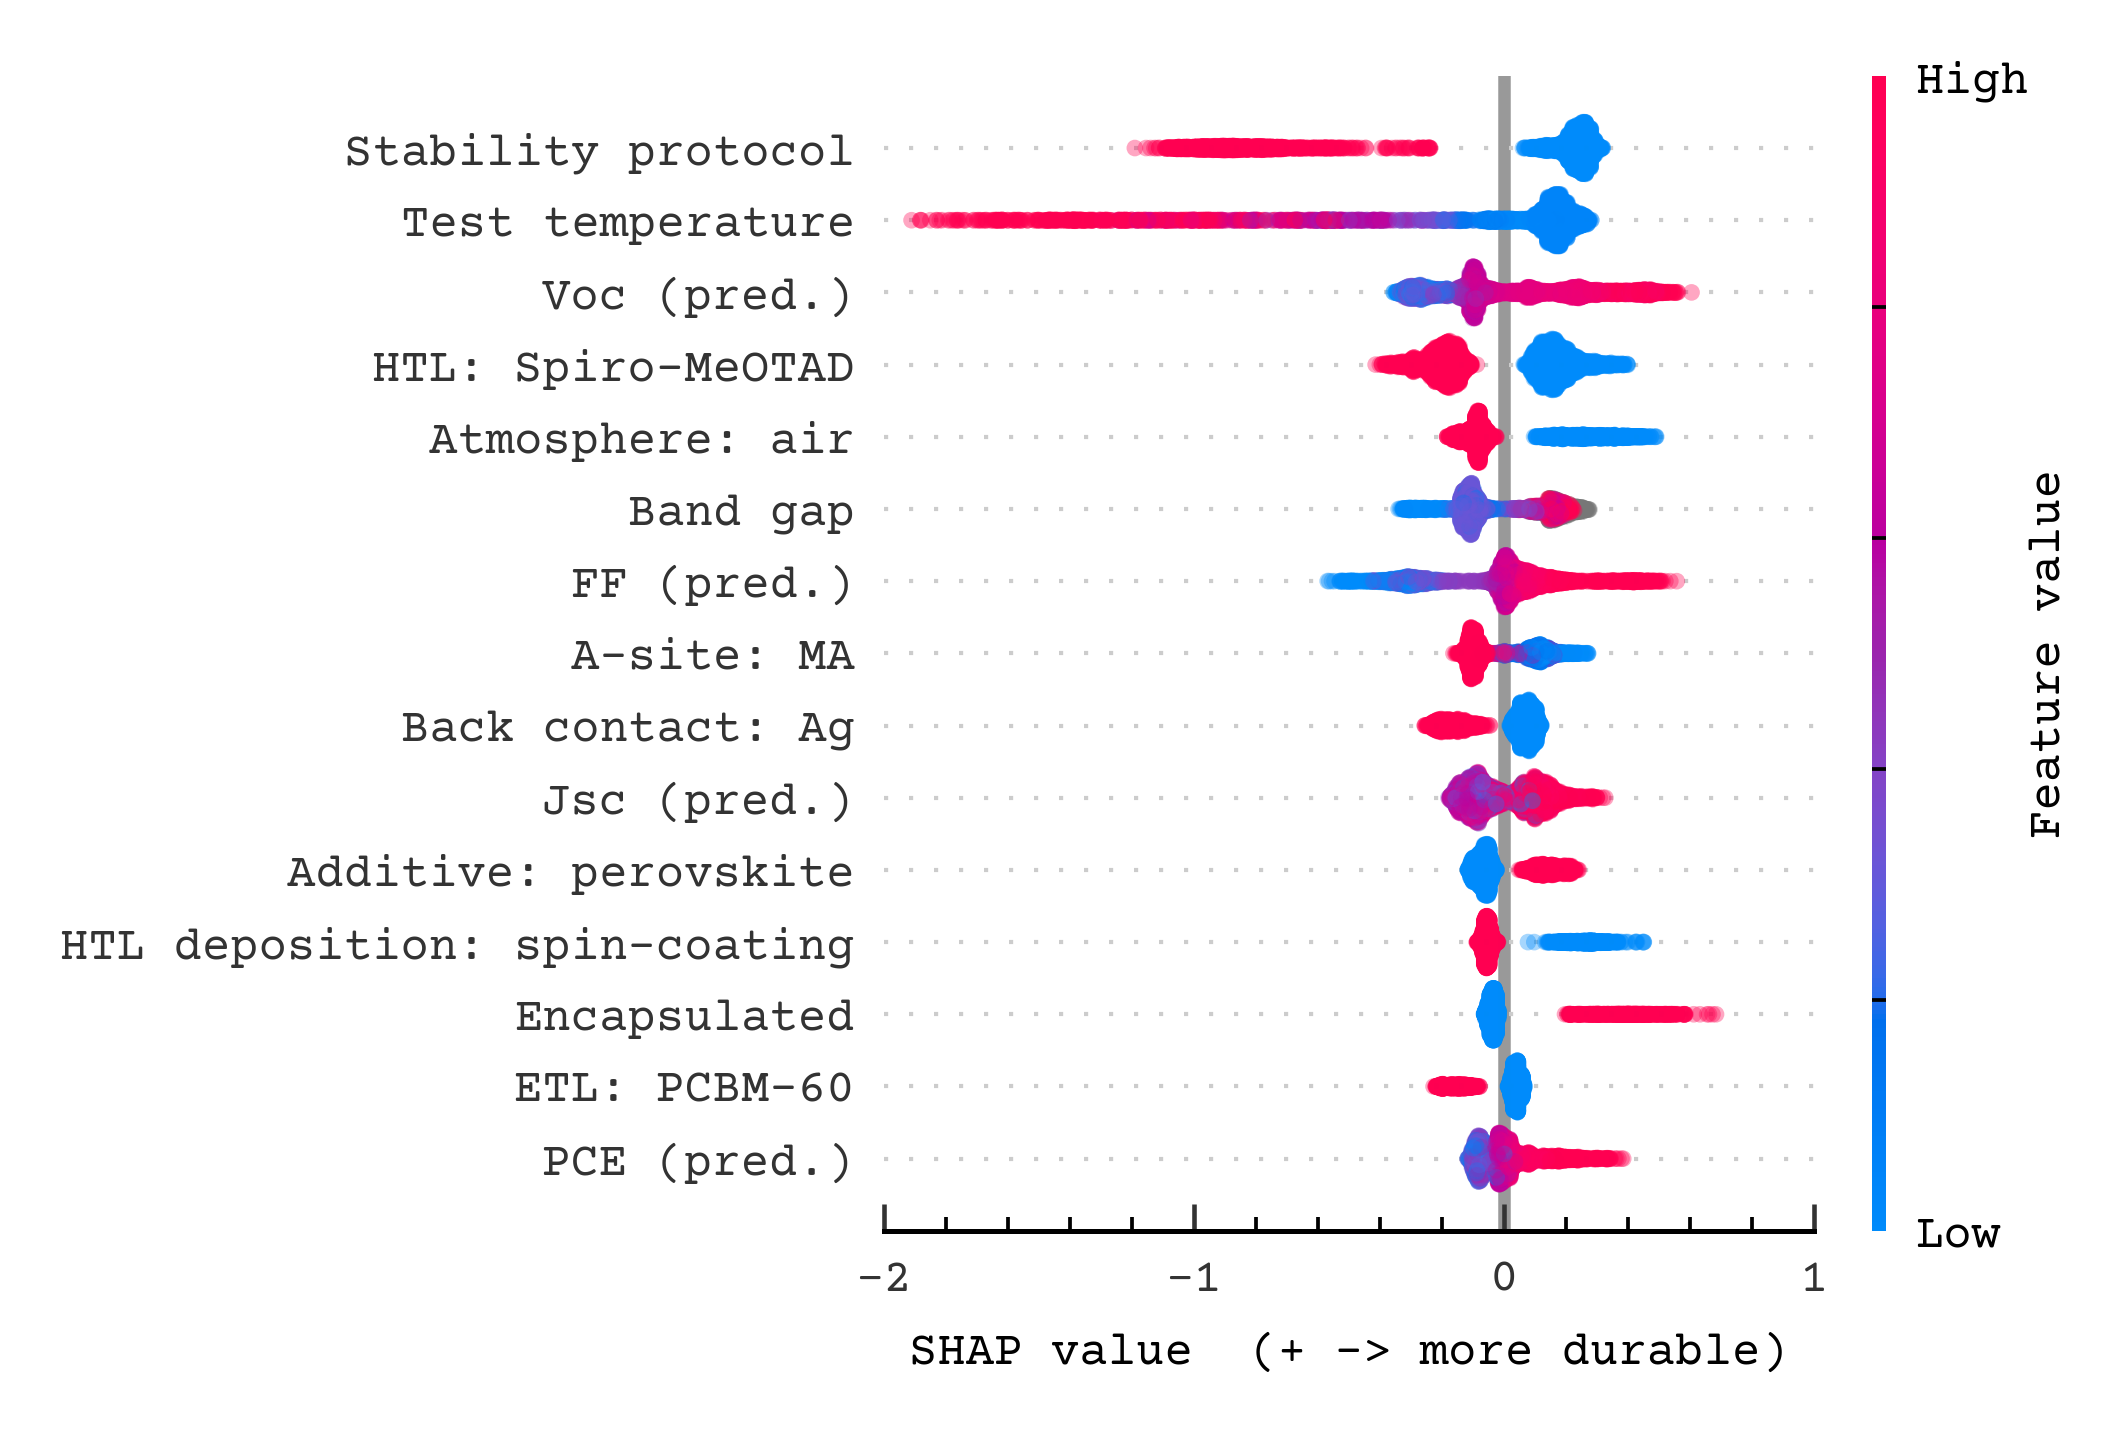
This kind of legibility turns the predictions into something you can trust.
The Actionable Output
These models allow you to find a perovskite solar cell with better properties for much faster and cheaper than ever before. They minimize the time and resources wasted while pushing performance.
This is the pattern Chronotope is built for. Across advanced materials, teams face the same structure of problem: huge design spaces, coupled physical interactions, scarce and messy data, expensive experiments, and slow qualification.
The future–and now present–of R&D is not trial and error. It is a straight path to the materials that will shape the world.
If you or your company want to be part of it, contact us to explore what's possible at contact@chronotope.ai.